Monitoring Performance Using KPIs
KPIs, or Key Performance Indicators, allow you to track performance in Milkymap. The KPIs that can be used can be set up by the Galaxy account admin or can be created by individual users. KPIs can be added to your Milkymaps at different levels, as well as different levels of your Life Cycle Model. By tracking the performance of your Customer Journeys and Life Cycle, you can improve Customer Experience in a targeted way.
Jump to
My KPIs and Our KPIs
There are two types of KPIs available to use in Milkymap: My KPIs and Our KPIs.
My KPIs
This type of KPI can be created by both users and admins. It can only be edited & used in Milkymaps by the person that has created it, not by other users. Other users can view it by accessing the Milkymaps in which it is used. To view ‘My KPIs', they need to be located in either published Milkymaps or ones that have been shared with you or you’ve been invited to comment on.
Our KPIs
Our KPIs can only be created by Galaxy account admins. They verify these items for use throughout your organisation’s account. Any user can add this KPI to their Milkymaps and add scores, but they can not edit the title, question, or range. Our KPIs can be recognized by their green border and the icon at the bottom. When you hover over an ‘Our KPI' icon, it will display that it’s a verified item used throughout your organisation.
A few examples of different KPIs you could set up:
NPS - Net Promoter Score, which can be scored from -100 to 100. An NPS score focuses on how likely a customer is to recommend something to other people and can be specified in different ways. You can distinguish different types of NPS to measure throughout your account, like tNPS or eNPS.
CES - Customer Effort Score, with a score ranging from 1-5. It represents how much effort a customer feels like they need to put in to complete an action.
CSAT - Customer Satisfaction score, ranging from 1-10. A customer feedback score that can be used at different levels, such as Episodes and Touchpoints in your Milkymaps.
Creating a KPI
In order to track performance in Milkymap, you first need to create a KPI. KPIs can be created in two different locations, the further steps and information you can add, however, are the same.
Through Content Management
Use the top menu bar to access ‘Content Management' and select KPIs from the dropdown.
Either press the area containing the ‘+' or press the ‘+ Create My KPI’ tab
OR, if you’re an admin and would like to create an ‘Our KPI’
Click the ‘Our KPIs’ tab
Press the area containing the ‘+' or the tab labelled 'Create Our KPI’This will open up either a window in which you can either create a ‘My KPI’ or ‘Our KPI’ by adding the right information.
KPI Information
By using the ‘Create My KPI’ or ‘Create Our KPI’ window, you can add a new KPI to your account. There are a few required fields, which are highlighted using *.
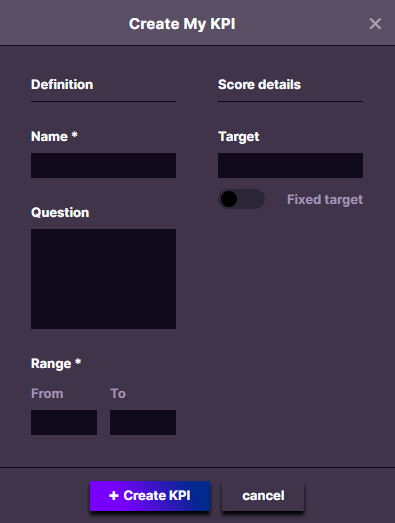
KPI Name* - Give your name a recognizable and clear name.
KPI Question - In this field, you can specify the question that was used to collect information. This can provide context for the people using this KPI or interpreting scores later.
KPI Range* - Specify the range for this KPI. Targets or scores that fall outside of this range cannot be saved. Many metrics have a specific range of scores, NPS for example ranges from -100 to 100.
KPI Target - Enter the target for this particular KPI here. If you haven’t decided on a target yet, you can also leave this field empty. You can decide on a versatile or a fixed target by using the toggle.
Fixed target - This target can not be adjusted when adding KPIs to different locations. It remains the same in every location in which it is used.
Versatile target - This target will show up as a suggestion when adding the KPI to different locations throughout the platform, but can be edited in the location. This also means that this KPI can have different targets in different locations.
Adding KPIs to Different Locations
You can either add KPIs at an overall Milkymap level through a Widget and/or add more specific KPI information through a Lane, at both an Episode and a Touchpoint Level. KPIs can also be used at all different levels of your Life Cycle Model.
Through a Widget
Add a new Widget by pressing the area labelled ‘+ add widget’ in the top right of your Milkymap.
This will open an Add Widget window, where you can select ‘Defined KPI’ as the Widget type.
This will add a KPI Widget or area, containing an ‘+ Add KPI’ button. Pressing this button will open up a new window, in which you can either create a new KPI or add an existing one.
A KPI Widget is meant to include the performance of a particular KPI for the overall Milkymap, at a Customer Journey level. An example of this would be measuring the overall satisfaction with the organisation based on a Customer Journey, by adding a Widget containing NPS to an onboarding journey Milkymap.
Through an Episode Lane
Add a new Lane.

Either by clicking this button in the top right-hand corner or by using the plus sign in the sidebar on the left side of your Milkymap.
Select ‘Defined KPI’ as the Lane type
An ‘+ Add KPI' button will now appear below every Episode you’ve created. By clicking this button, you can add an existing KPI or create a new one to fit this location.
Adding KPIs at a Lane level allows you to add performance indicators that are more specific. An example would be a Customer Journey about going on vacation, where you can add a Customer Effort Score for the Episode containing the booking process.
Through a Touchpoint Lane
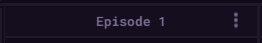
Press the Episode header of the Episode you’d like to put information into. The Episode header is above the Episode title and contains the number of the Episode.
By pressing the Episode header, you’ll open the ‘Edit Episode' window. In this window, you’ll be able to create Touchpoint Lanes.
In the ‘Edit Episode’ window, press the '+' in the left sidebar to add a new Touchpoint Lane.
Select the Touchpoint Lane Type ‘Defined KPI’ by clicking it.
A new button labelled ‘add KPI’ will now appear below every Touchpoint you’ve added. Click this button to either create a completely new KPI or add a KPI that already exists in your organisation’s account.
An example of using KPIs at a Touchpoint level could be to use a Customer Satisfaction Score to measure the Customer Experience across similar Touchpoints with different channels.
Only Galaxy account admins can add Widgets to a Life Cycle Model. The added content can however be viewed by all other user types.
Through a Life Cycle Model Widget
In your Dashboard, press the Life Cycle Model you’d like to add content to. You’ll automatically see it displayed in the circle overview, which is the right overview to add content.
Press the ‘Content’ tab and switch on the 'Edit' toggle there.
Select the level to add your KPI to. You can select any Stage, Phase or Contact Reason.
Click the ‘+' are or use the ‘+ Add Widget’ button and select 'Defined KPI’ as the Widget type.
This will add a KPI Widget area containing an ‘+ Add KPI’ button. By clicking this button you can add either an existing ‘My KPI’ or ‘Our KPI’ or create a new one.
Adding and Scoring KPIs
Press the ‘+ Add KPI’ button in your preferred location. This will open up a Select KPI window where you have an overview of ‘My KPIs’, ‘Our KPIs’ and the option to add a new KPI.
Click the KPI you would like to add. This will add this KPI to your preferred location.
Now you can press the KPI to add the last information.
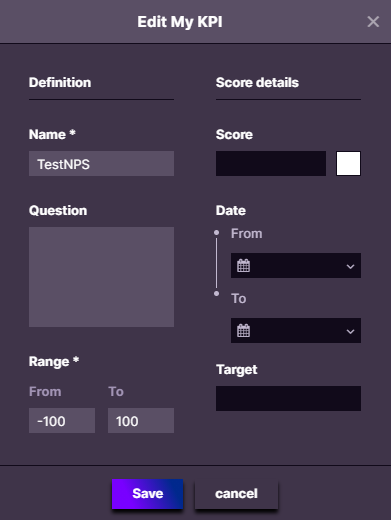
KPI Score - In this field, you can add the score for this KPI that matches this location. All scores added have to fall within the specified range.
KPI Colour - Choose a colour for the KPI score by pressing this field. It will show in the display of this KPI and can be used to visualize the score. You can assign a certain colour to a particular KPI or use different colours to indicate if the KPI is on target or not.
KPI Date Range - Use these fields to specify the date range in which this score has been measured.
Target - If this KPI doesn’t have a fixed target, you can add the target here.
Simply press save to add all your KPI information to your KPI in this location.
You can also decide to not fill the KPI. An unfilled KPI is useful for templates or if you need another user to complete the information.